PropLab TPLUS ENGINEERING GMBH
DE EN
SIGN IN
[ RESULTS ]

What you get from PropLab.

Each stage delivers its own results: the 1D design a selection of evaluated designs, the CFD the flow field around your propeller, and the FEM strength and vibration behaviour. All results are available in the portal in your browser, supplemented by reports as PDF.

The images show examples from reference calculations. You receive your results in the same form for your propeller.

[01]1D DESIGN

The Pareto front and every design in detail.

The design process yields the Pareto front: all designs in which one objective can only be improved at the expense of another. You choose interactively between power, mass and noise and narrow down the selection with sliders according to your priorities.

Each design comes with the key figures per mission point – rotational speed, power, efficiency or figure of merit and blade tip Mach number –, a true-to-scale top view, and the quick check for structure and noise. The design report summarises the results as a PDF, in German and English. The complete blade geometry is part of the CAD model.

Power → Noise ↑
PARETO FRONT · THE PALER, THE FURTHER AWAY
RESULT
Pareto front, key figures per mission point, top view
CHECKS
Structure (indicative), noise in dB(A)
DELIVERY
View in the browser, design report as PDF (DE/EN), CAD model as STEP and STL optional
[02]CFD SIMULATION

The flow field, layer by layer.

The results of your CFD simulation are presented in our viewer in the browser. All views are already set up, so you can concentrate on the results. No additional software is required.

Each key figure of the simulation is set against the 1D prediction. This shows not only the result itself but also how well the fast design calculation predicted the operating point.

KEY FIGURES
Thrust, torque, power, efficiency or figure of merit – each alongside the 1D prediction
CALCULATION TYPE
Steady or unsteady, chosen per flight state
DELIVERY
3D viewer in the browser, technical report as PDF
VIEWS IN THE VIEWER
  • Surface pressure
  • Velocity
  • Streamlines
  • Blade tip vortices
  • Acoustic sources
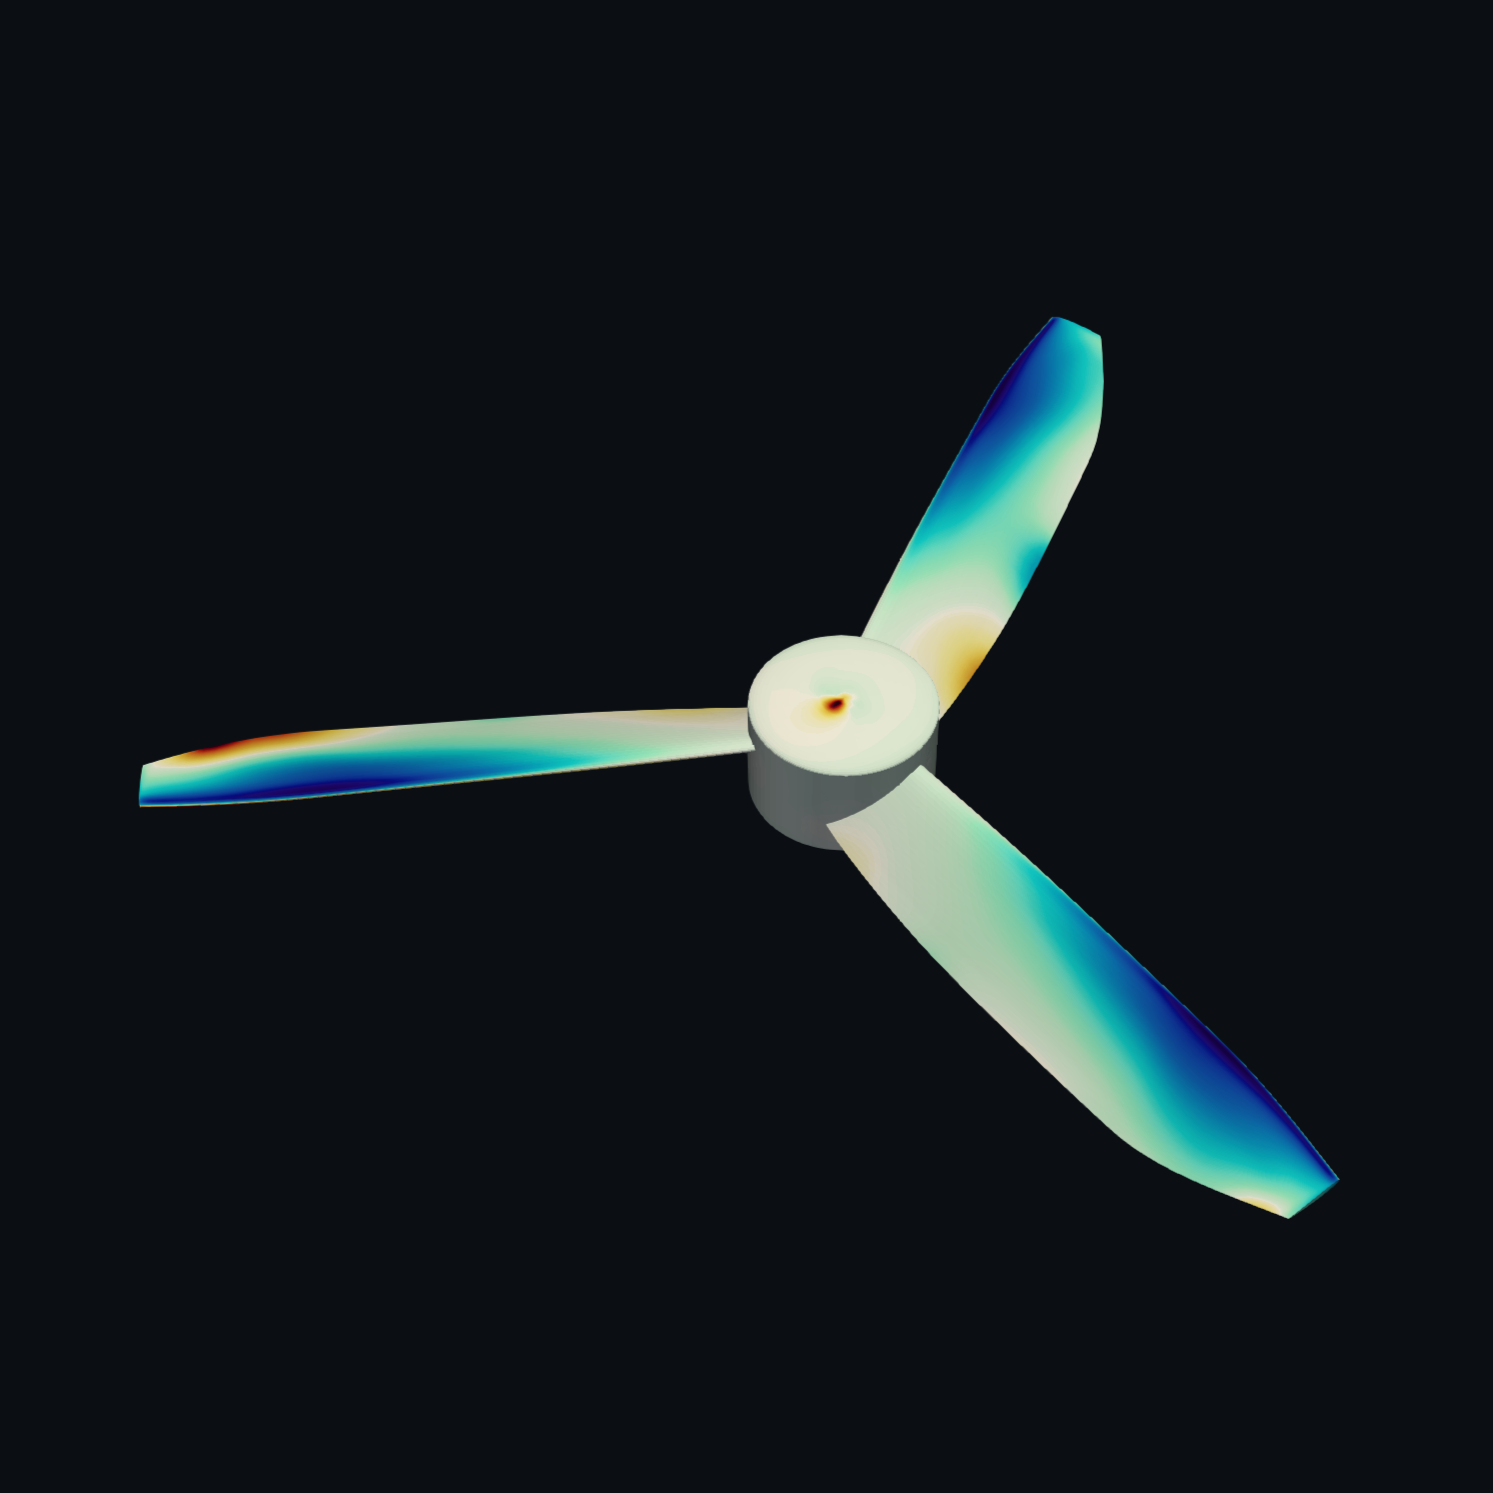
Surface pressure, image 1 of 2
VIEW 01.1 — SURFACE PRESSURECFD RESULT: UNSTEADY CALCULATION
01Surface pressurePressure distribution on blades and hub, instantaneous and, for unsteady calculations, also time-averaged.
02VelocityMagnitude of the flow velocity in the mid-plane, just below the rotor plane and in two wake sections.
03StreamlinesPath of the air through the rotor plane, coloured by velocity.
04Blade tip vorticesVortex trails behind the blade tips as an isosurface of the Q-criterion.
05Acoustic sourcesLocations of noise generation in the flow field, estimated according to Proudman.
[03]FEM STRUCTURAL ANALYSIS

Strength and natural frequencies of the rotating propeller.

The static structural analysis shows deformation and equivalent stress under centrifugal force at overspeed, as well as the reserve against the permissible stress of the material.

The modal analysis of the loaded model yields the natural frequencies and mode shapes of the rotating propeller. The mode shapes can be viewed as animations in the viewer. The Campbell diagram plots the natural frequencies over rotational speed against the multiples of the rotational frequency – showing whether there are resonances within the operating range.
Animated first mode shape of a three-bladed propeller: one blade oscillates up and down relative to the undeformed outline shown in grey
1ST MODE SHAPE, 47.6 HZ · SHOWN EXAGGERATEDFEM RESULT: MODAL ANALYSIS
Operation 1× 2× 3× 4× 1st mode Rotational speed → Frequency ↑
SCHEMATIC — CAMPBELL DIAGRAM: NATURAL FREQUENCIES OVER ROTATIONAL SPEED, DASHED: MULTIPLES OF THE ROTATIONAL FREQUENCY
RESULT
Deformation, equivalent stress, reserve; natural frequencies and mode shapes
PRESENTATION
3D viewer with colour bands and animation, Campbell diagram
MATERIAL
Currently isotropic (PA6-GF30), fibre composites on request

The 1D design is free of charge.

Start for free View pricing
PropLab
[ RESULTS ]

What you get from PropLab.

Each stage delivers its own results: the 1D design a selection of evaluated designs, the CFD the flow field around your propeller, and the FEM strength and vibration behaviour. All results are available in the portal in your browser, supplemented by reports as PDF.

The images show examples from reference calculations. You receive your results in the same form for your propeller.

[01]1D DESIGN

The Pareto front and every design in detail.

The design process yields the Pareto front: all designs in which one objective can only be improved at the expense of another. You choose interactively between power, mass and noise and narrow down the selection with sliders according to your priorities.

Each design comes with the key figures per mission point – rotational speed, power, efficiency or figure of merit and blade tip Mach number –, a true-to-scale top view, and the quick check for structure and noise. The design report summarises the results as a PDF, in German and English. The complete blade geometry is part of the CAD model.

Power → Noise ↑
PARETO FRONT · THE PALER, THE FURTHER AWAY
RESULT
Pareto front, key figures per mission point, top view
CHECKS
Structure (indicative), noise in dB(A)
DELIVERY
View in the browser, design report as PDF (DE/EN), CAD model as STEP and STL optional
[02]CFD SIMULATION

The flow field, layer by layer.

The results of your CFD simulation are presented in our viewer in the browser. All views are already set up, so you can concentrate on the results. No additional software is required.

Each key figure of the simulation is set against the 1D prediction. This shows not only the result itself but also how well the fast design calculation predicted the operating point.

Surface pressure, image 1 of 2
VIEW 01.1 — SURFACE PRESSURE · CFD RESULT: UNSTEADY CALCULATION
  • Surface pressure
  • Velocity
  • Streamlines
  • Blade tip vortices
  • Acoustic sources
01 Surface pressurePressure distribution on blades and hub, instantaneous and, for unsteady calculations, also time-averaged.
02 VelocityMagnitude of the flow velocity in the mid-plane, just below the rotor plane and in two wake sections.
03 StreamlinesPath of the air through the rotor plane, coloured by velocity.
04 Blade tip vorticesVortex trails behind the blade tips as an isosurface of the Q-criterion.
05 Acoustic sourcesLocations of noise generation in the flow field, estimated according to Proudman.
KEY FIGURES
Thrust, torque, power, efficiency or figure of merit – each alongside the 1D prediction
CALCULATION TYPE
Steady or unsteady, chosen per flight state
DELIVERY
3D viewer in the browser, technical report as PDF
[03]FEM STRUCTURAL ANALYSIS

Strength and natural frequencies of the rotating propeller.

The static structural analysis shows deformation and equivalent stress under centrifugal force at overspeed, as well as the reserve against the permissible stress of the material.

The modal analysis of the loaded model yields the natural frequencies and mode shapes of the rotating propeller. The mode shapes can be viewed as animations in the viewer. The Campbell diagram plots the natural frequencies over rotational speed against the multiples of the rotational frequency – showing whether there are resonances within the operating range.

Animated first mode shape of a three-bladed propeller: one blade oscillates up and down relative to the undeformed outline shown in grey
1ST MODE SHAPE (FLAPPING), 47.6 HZ · DEFORMATION EXAGGERATED · FEM RESULT: MODAL ANALYSIS
Operation 1× 2× 3× 4× 1st mode Rotational speed → Frequency ↑
SCHEMATIC — CAMPBELL DIAGRAM
RESULT
Deformation, equivalent stress, reserve; natural frequencies and mode shapes
PRESENTATION
3D viewer with colour bands and animation, Campbell diagram
MATERIAL
Currently isotropic (PA6-GF30), fibre composites on request

The 1D design is free of charge.

Start for free View pricing